Author: Johanna Scheidegger, British Geological Survey, January 2026
What is the Philippine Hydrological Model?
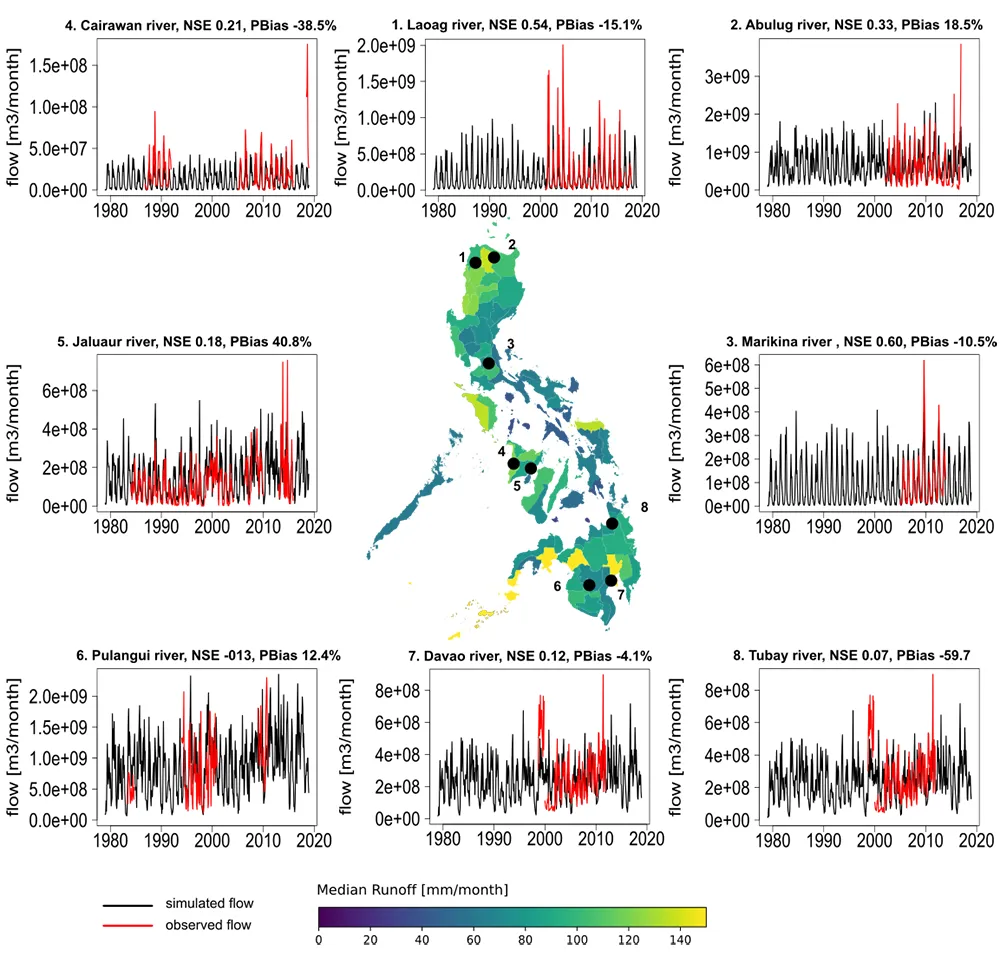
The Philippine Hydrological Model (PHM) is a national-scale hydrological model of the country (Scheidegger et al. 2023). Its primary purpose is to quantify components of the hydrological cycle at the regional to national level, for example, river flows shown in Figure 1. The model simulates the integrated surface water and groundwater system and has been developed using a version of the macro-scale hydrological modelling software, VIC, into which a gridded groundwater model has been added (Scheidegger et al. 2021). It generates spatio-temporal patterns of precipitation, evapotranspiration, surface runoff, river flow, groundwater recharge, and groundwater flow as outputs.
The PHM model currently simulates the 'natural' hydrological system and so the human modification of the water cycle is not considered in this version. The model has been constructed using openly available global data sets and calibrated against local observations, principally of river flows. It has been run over both the historical period 1979 to 2018 and to examine the effect of potential future climate over the period 1980 to 2089. The resulting modelling framework provides a means to develop understanding of the water resources across the Philippines and aims to support future national water resources planning. A web platform displaying its output can be found here: Philippine Hydrological Model.
How does the model work?
To simulate the hydrology of the Philippines, we use the integrated VIC hydrological model coupled to a lateral groundwater flow model (VIC-AMHAS), as developed by Scheidegger et al. (2021). The model framework is illustrated in Figure 2. VIC is a macro-scale hydrological model, which has been applied widely for water and energy balance studies (Hamman et al. 2018). The model describes full water and energy transport over a grid cell. When precipitation reaches the land surface, it is partitioned into evaporation, runoff and infiltration. To accumulate flows at river gauging stations, routing of runoff and baseflow is performed by post-processing model output (Lohmann et al. 1996).
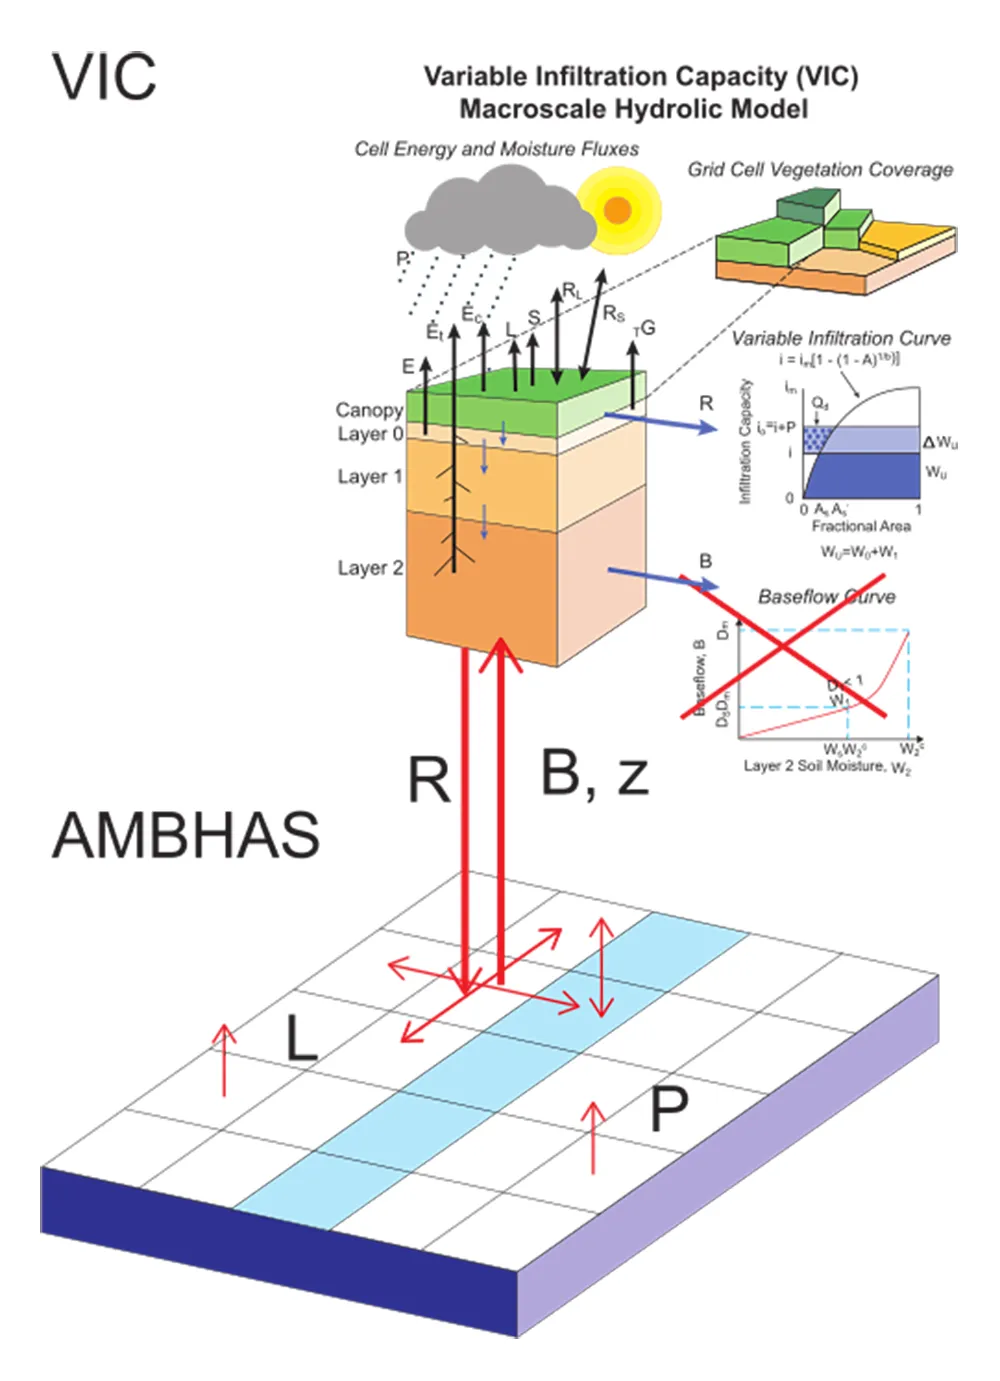
The soil column in VIC is coupled using bi-directional exchange of water between the soil and the aquifer. The aquifer allows for river baseflow, abstraction and leakage. The lateral groundwater model coupled to VIC is a distributed, one-layer, two-dimensional groundwater model driven by groundwater recharge and groundwater pumping. Groundwater recharge is derived from interaction of the groundwater model with the VIC soil by allowing bi-directional exchange of water between the aquifer and the soil. A full description of the lateral groundwater model and coupling to VIC is given by Scheidegger et al. (2021).
What inputs does the model need?
The model is run on a 1/60° (~2 km) grid across the country and is driven with openly available global datasets. The model is parameterised with spatially distributed parameters from a range of sources that describe the land surface, including soil properties and vegetation properties. The soil properties such as field capacity, plant available water, wilting point, saturated hydraulic conductivity, and residual saturation for the VIC model are taken from a global high-resolution map of soil hydraulic properties (Zhang and Marcel 2018). The soil quartz fraction and bulk density values are from SoilGrid1km (Hengl et al. 2014). Landcover vegetation parameters are taken from Modis (Friedl and Sulla-Menashe 2015), leaf area index and albedo from Copernicus (Smets et al. 2019), and vegetation height from LiDAR-derived Global Estimates of Forest Canopy Height (Healey et al. 2015). The groundwater part of the model requires values for hydraulic conductivity and specific yield, which are classified based on the groundwater availability map of the Philippines (Bureau of Mines and Geo-Sciences and Ministry of Natural Resources 1986). A full description of the model is given by Scheidegger et al. (2022).
The VIC model is driven by meteorological forcing data using gridded, sub-daily time-series of meteorological variables as input. Average air temperature, total precipitation, atmospheric pressure, incoming shortwave radiation, incoming longwave radiation, vapor pressure, and wind speed are required. For the historical simulation (1979 to 2018), ERA5 hourly data from 1979 to present are used (Hersbach et al. 2018). The meteorological forcing data is at 0.25°, and hence a much coarser resolution than the soil and vegetation parameters.
The 'Future Projections of the Hydrology of the Philippines' provides projections of hydrological change for the period 1980 to 2089 generated using the UKCP18 climate change projections based on two greenhouse gas 'representative concentration pathways' (RCP): RCP2.6 and RCP 8.5 (Met Office Hadley Centre 2018). RCP2.6 represents a mitigation scenario aiming to limit the increase of mean global mean temperature to around 1.6C° by 2100 above preindustrial level for mid-range climate sensitivity. In contrast, RCP8.5 is a pathway where greenhouse gas emissions continue to grow unmitigated and lead to an estimated global average temperature rise of 4.3°C above preindustrial level by 2100. It is to note that the estimated ranges for future climate are conditioned on a set of modelling, statistical, and dataset choice assumption with expert judgement in methodological and data choices by the producers of the UKCP18 dataset. The probabilities of the projections are interpreted as an indication of a particular future climate outcome for a given representative concentration pathway and there is more evidence for outcomes near the centre of the distribution than in the tails (Fung et al. 2018). Each of the two climate projections is composed of a 15-member ensemble, representing the uncertainty in the simulations of future climate. The UKCP18 future climate data has a spatial resolution of 0.8333° x 0.5556°.
What can the model be used for?
A few example usages for the Philippine hydrological model are listed below, they range from comparison of regional and seasonal hydrological components of the water cycle, analysis of spatial changes in extreme events, future projected changes in the hydrology and their spatial distribution, and estimation of groundwater recharge across the country.
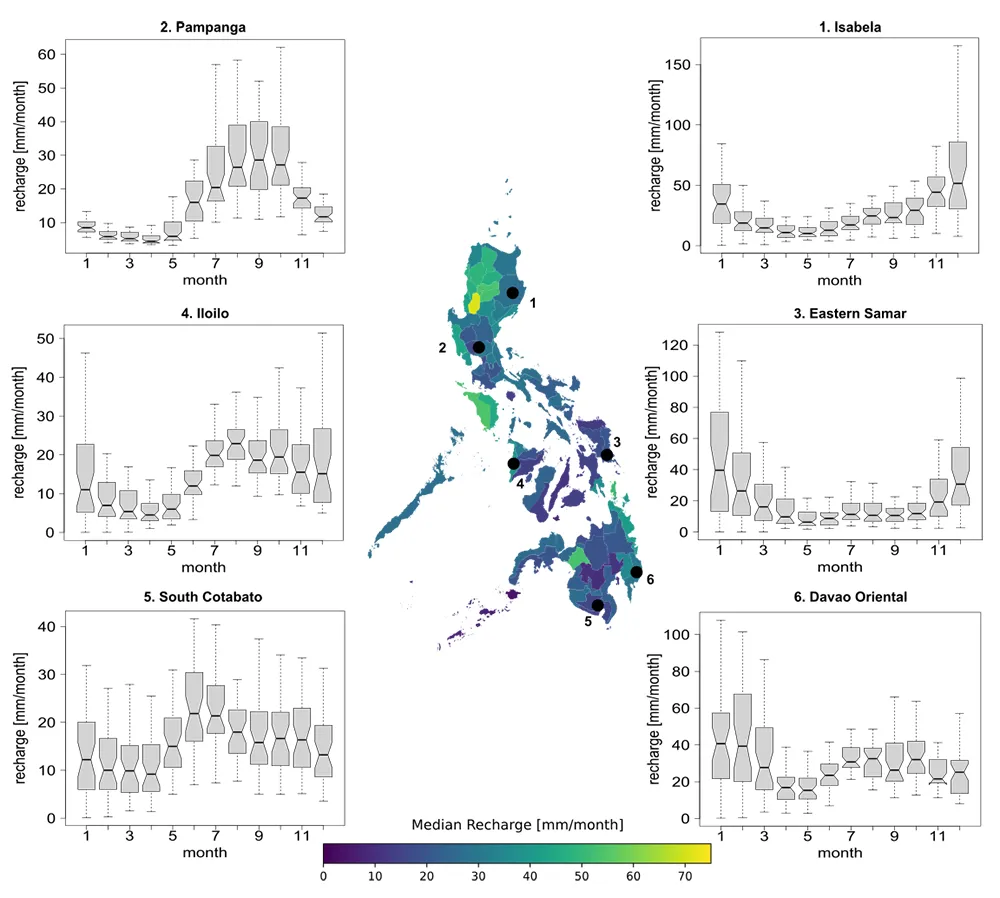
Regional comparison of components of the water cycle: Figure 3 shows the median groundwater recharge across the Philippines aggregated to provincial levels. The seasonal distribution of groundwater recharge for six selected provinces is presented using a boxplot. There is a large interannual variability in groundwater recharge in most provinces, especially in months with a higher recharge.
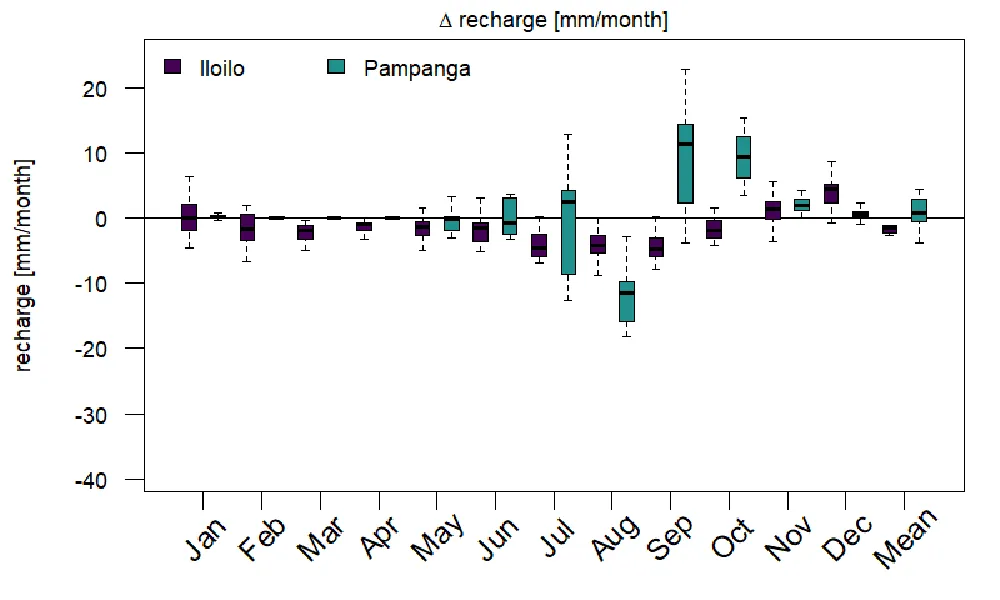
Estimating future changes in components of the water cycle: for example, the simulated groundwater recharge for the period 2060 to 2089 in Pampanga (Figure 4) is projected to be on average similar to 1990 to 2019, however different ensemble members of the UKCP18 climate change scenario yield a different result. The climate change projections also show a shift in seasonality; the change in recharge for different months does not have a consistent pattern, for example, August is projected to become drier, and September wetter in Pampanga.
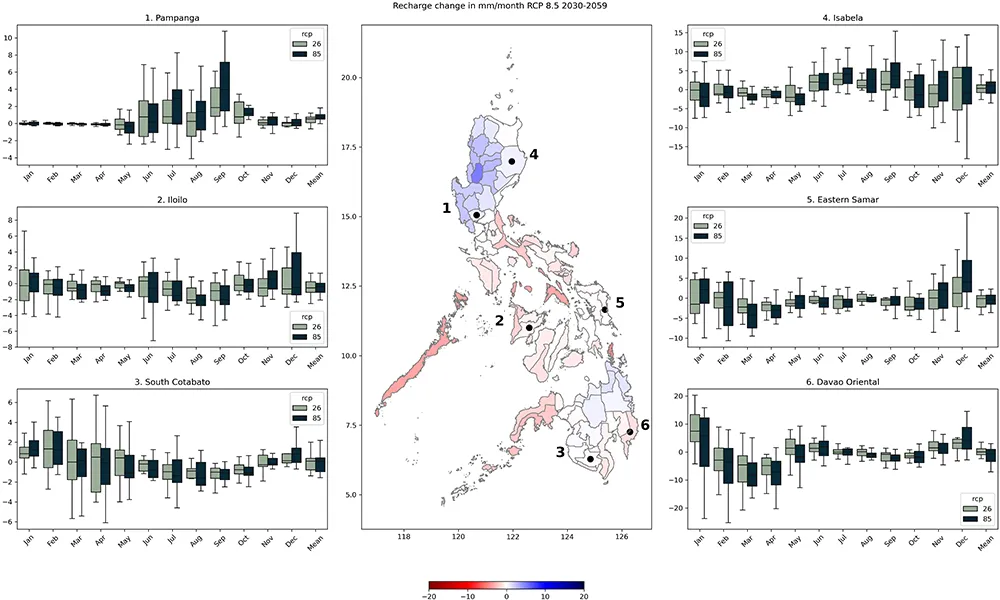
Estimating historical and future groundwater recharge regions: Figure 5 shows the projected changes in groundwater recharge for the periods 2030 to 2059 relative to the historical baseline from 1990 to 2019. The spread of the different ensemble members is large.
Regional comparison of hydrological extremes: For exmaple, how is the frequency in hydrological extremes changing over time regionally?
An overview of the model results is given of the Philippine Hydrological Model dashboard.
What are the limitations of the Philippine Hydrological Model?
As with all models, the model has its limitations and shortcomings:
- The model represents the natural hydrological cycle. Abstraction from groundwater or surface water, dams or water transfers are not considered.
- The model provides a regional overview of hydrology — small scale processes or heterogeneities are not considered. The model uses many global datasets, most of them are published at 1 km. The model output relies on the quality of the model inputs.
- The climate drivers are from ERA5 for the historical model and UKCP18 for the future climate change projections. The spatial resolution of the climate data is coarser than that of the model.
- We only used river flow data from the Department of Public Works and Highways to calibrate the model, and the model is only calibrated on a country level. All other variables are uncalibrated.
- No land use change has been considered.
How can it be improved in the future?
Model improvements will depend on the application, and could include cropping of the model to an area of interest, downscaling of the model parameters, updated parameterisation with additional data, calibration to additional observations, such as groundwater levels and river flows, and the inclusion of human impacts.
- Compare the model to other data sets obtained from earth observation, such as evapotranspiration, soil moisture and runoff.
- For regional studies, the model can be cut to the region of interest, the spatial resolution can be refined, and the parameterisation could be tuned to the specific catchment.
- The use of different climate forcing data tailored to the Philippines.
- Inclusion of human impacts, such as surface water and groundwater abstraction for domestic, industrial and agricultural purposes.
How can I use the model output directly?
- The model outputs are openly available. Refer to the user guides below for more information
- Data set for historical simulations (1979 to 2018): Philippine National Hydrological Model Dataset | NGDC Cited Data | National Geoscience Data Centre (NGDC) | Our data | British Geological Survey (BGS)
- Guidance on how to use the model outputs: User guide: BGS Philippine National Hydrological Model dataset - NERC Open Research Archive
- Dataset for future projections simulations (1980 to 2089): Future projections of the hydrology of the Philippines dataset | NGDC Cited Data | National Geoscience Data Centre (NGDC) | Our data | British Geological Survey (BGS)
- Guidance on how to use the future projections of the Philippine Hydrological Model: Future projections of the hydrology of the Philippines: dataset summary - NERC Open Research Archive
I want to dig deeper; how can I run the model?
- If you would like to further develop the model, the model files can be downloaded from HydroShare: VIC-AMBHAS input files for the Philippine Hydrological Model | CUAHSI HydroShare
- For more information about how to run the model visit RunVIC - VIC
- This version of the code can use different resolution model data and climate drivers and is used for the Philippine Hydrological Model: BritishGeologicalSurvey/VIC at VIC-AMBHAS-GRID
References
Bureau of Mines and Geo-Sciences and Ministry of Natural Resources. 1986. Groundwater availability map of the Philippines, Bureau of Mines and Geo-Sciences, Metro Manila, Philippines
Department of Public Works and Highways. 2016. National Hydrologic Data Collection Program (NHDCP)
Friedl, M and Sulla-Menashe, D. 2015. MCD12C1 MODIS/Terra+Aqua Land Cover Type Yearly L3 Global 0.05Deg CMG V006. 2015, distributed by NASA EOSDIS Land Processes DAAC. DOI: 10.5067/MODIS/MCD12C1.006
Fung, F, Lowe, J, Mitchell, J, Murphy, J, Bernie, D, Gohar, L, Harris, G, Howard, T, Kendon, E, Maisey, P, Palmer, M and Sexton, D. 2018. UKCP18 Guidance: Caveats and Limitations. Met Office Hadley Centre, Exeter
Hamman, J J, Nijssen, B, Bohn, T J, Gergel, D R and Mao, Y X. 2018. The Variable Infiltration Capacity model version 5 (VIC-5): infrastructure improvements for new applications and reproducibility. Geoscientific Model Development 11(8), 3481-3496, DOI: 10.5194/gmd-11-3481-2018
Healey, S P, M.W. Hernandez, D.P. Edwards, M.A. Lefsky, E. Freeman, P.L. Patterson, E.J. Lindquist and Lister, A J. 2015. CMS: GLAS LiDAR-derived Global Estimates of Forest Canopy Height, 2004-2008. DOI: 10.3334/ORNLDAAC/1271
Hengl, T, de Jesus, J M, MacMillan, R A, Batjes, N H, Heuvelink, G B, Ribeiro, E, Samuel-Rosa, A, Kempen, B, Leenaars, J G, Walsh, M G and Gonzalez, M R. 2014. SoilGrids1km—global soil information based on automated mapping. PLOS ONE 9(8), e105992, DOI: 10.1371/journal.pone.0105992
Hersbach, H, Bell, B, Berrisford, P, Biavati, G, Horányi, A, Muñoz Sabater, J, Nicolas, J, Peubey, C, Radu, R, Rozum, I, Schepers, D, Simmons, A, Soci, C, Dee, D and Thépaut, J N. 2018. ERA5 hourly data on single levels from 1979 to present. DOI: 10.24381/cds.adbb2d47
Lohmann, D, Nolte-Holube, R and Raschke, E. 1996. A large-scale horizontal routing model to be coupled to land surface parametrization schemes. Tellus, Series A: Dynamic Meteorology and Oceanography 48(5), 708-721, DOI: 10.3402/tellusa.v48i5.12200
Met Office Hadley Centre 2018. UKCP18 Global Climate Model Projections for the entire globe. Centre for Environmental Data Analysis.
Scheidegger, J. 2025. Future projections of the hydrology of the Philippines: dataset summary. OR/25/010
Scheidegger, J M, Barkwith, A, Jackson, C R, Mansour, M, Guzman, A. 2023. Philippine Hydrological Model. British Geological Survey Report OR/23/053
Scheidegger, J M, Jackson, C R, Barkwith, A, Wang, L and Guzman, M A L G. 2022. Hydrological modelling for Panay and Pampanga, Philippines 1979 - 2089. OR/22/057.
Scheidegger, J M, Jackson, C R, Muddu, S, Tomer, S K and Filgueira, R. 2021. Integration of 2D Lateral Groundwater Flow into the Variable Infiltration Capacity (VIC) Model and Effects on Simulated Fluxes for Different Grid Resolutions and Aquifer Diffusivities. Water 13(5), 663, DOI: 10.3390/w13050663
Smets, B, Verger, A, Camacho, F, Van der Goten, R and Jacobs, T. 2019. Copernicus Global Land Operations "Vegetation and Energy".
Zhang, Y and Marcel, G S 2018. A High-Resolution Global Map of Soil Hydraulic Properties Produced by a Hierarchical Parameterization of a Physically-Based Water Retention Model. Yonggen, Z and Marcel, G S. DOI: 10.7910/DVN/UI5LCE